If you’re an asset manager, financial advisor, or investor relations professional, knowing how to read a fund fact sheet is essential. These documents play a crucial role in fund marketing and compliance, offering a clear, concise snapshot of a fund’s performance, objectives, fees, and risk profile. A well-designed fact sheet helps investors make informed decisions while enhancing the transparency and credibility of the asset manager.
But what should a good fund fact sheet include? How can you ensure that your document remains visually engaging, easy to navigate and aligned with regulatory standards? And most importantly, how can you automate the production process to save time and reduce errors with a database publishing?
In this guide, we break down the key elements of a fund fact sheet and explain why each one matters. Whether you’re reviewing documents or planning to produce them, this article will help you better understand the structure and function of fund facts.
Table of Contents
- Essential Components of Fund Fact Sheet
- Performance Snapshot Components
- Automated Production with Pagination
Essential Components of Fund Fact Sheet
Quick Facts
This first section gives readers a snapshot of the fund. You’ll usually find the launch date, name of the fund manager, assets under management, frequency of distributions, fees like the MER, and the minimum investment required. Some fund facts also include fund codes and distribution methods.
Investment Objective and Portfolio Snapshot
Next comes the strategy. This part explains what the fund is trying to achieve: capital growth, income, diversification and how it plans to get there.
You’ll typically see a list of the top 10 holdings, the total number of securities, and a breakdown by asset class or geography. These details help investors understand how the fund is positioned in the market.
Risk Assessment
Understanding risk is a big part of making an informed decision. Most fact sheets include a risk scale, usually from low to high, that helps readers understand potential volatility. Some versions even explain how the risk rating is calculated and what factors might lead to a change.
Performance History
This section is often the most closely examined. It shows how the fund has performed over time: annual returns, best and worst three-month periods, and compound average return.
More sophisticated fact sheets also compare the fund’s performance to a benchmark index and include growth charts and monthly return tables.
Investor Profile
It explains who the fund is meant for, based on things like investment horizon, income needs, and comfort with market volatility. Some investor profiles also highlight behavioural traits, such as whether someone prefers to be hands-on or hands-off with their investments.
Tax Information
This section covers how distributions are taxed depending on whether the fund is held in a registered or taxable account. Well-structured fund facts also explain that distributions are taxable whether received in cash or reinvested, which helps avoid confusion.
Fees and Expenses
Here you’ll find a detailed breakdown of costs: sales charges, management fees (MER), trading expenses (TER), and in some cases, trailing commissions. Some documents include cost examples showing how fees affect a $1,000 investment over time.
Rights and Disclaimers
This section outlines investor rights, including how to withdraw from a purchase or take legal action in case of misrepresentation. Some fund facts even reference provincial laws or deadlines for claims.
You can explore a real regulatory-compliant fund fact sheet using this interactive sample from the Canadian Securities Administrators.
Performance Snapshot Components
In addition to producing standard fund facts, many investment firms also create monthly performance summaries to keep investors informed between full reporting cycles. These documents include regularly updated performance metrics, holdings breakdowns, sector exposures and key risk indicators.
In this context, it becomes especially useful to automate the workflow of monthly reporting, ensuring data is pulled correctly, charts are regenerated and layouts remain consistent each time.
The following section explains the structure and content of such a monthly document, taking as reference the one created with our client Ninepoint Partners.
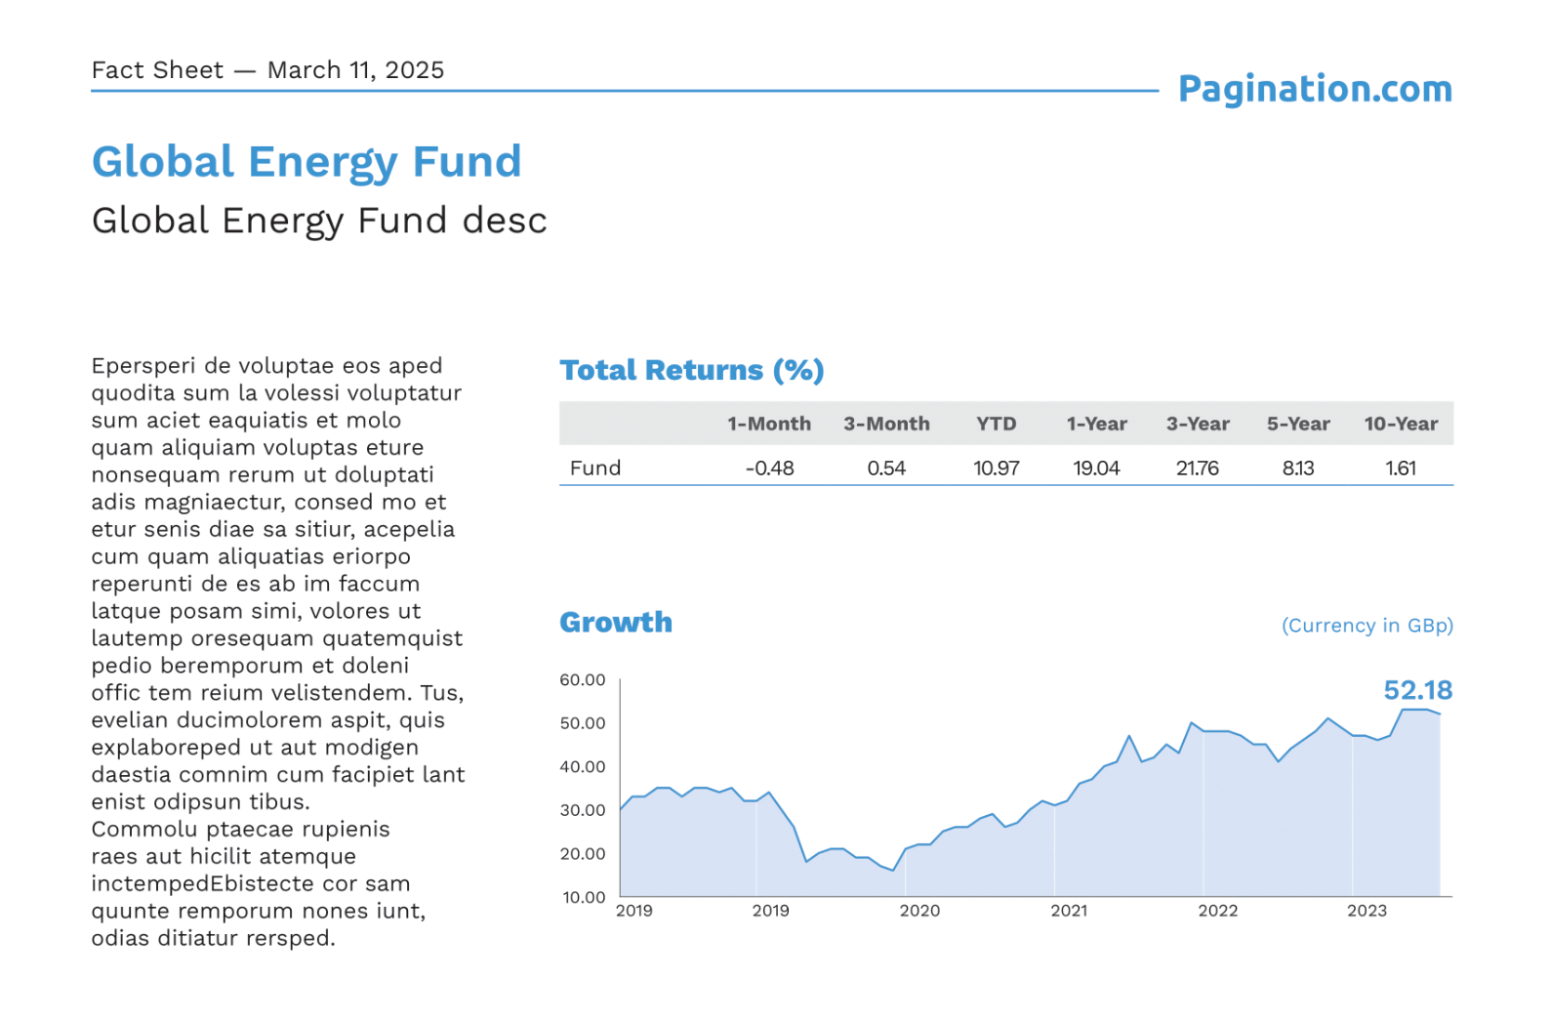
Compounded Returns
The document opens with a summary table showing compounded returns over multiple periods (1 month, 3 months, YTD, 1 year, 3 years, etc.), helping readers understand how the fund has performed over different time horizons. 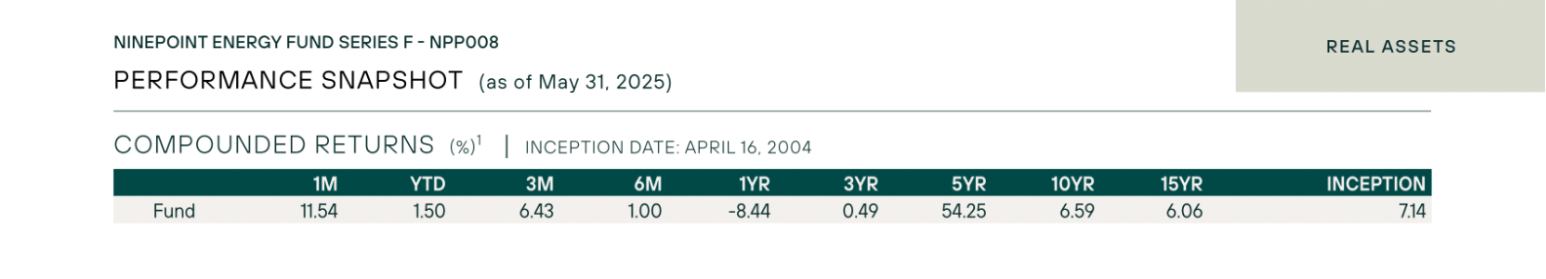
Monthly Return Table
This section presents monthly returns going back several years in a dense, yet readable matrix. It allows for quick visual comparison of performance trends over time.
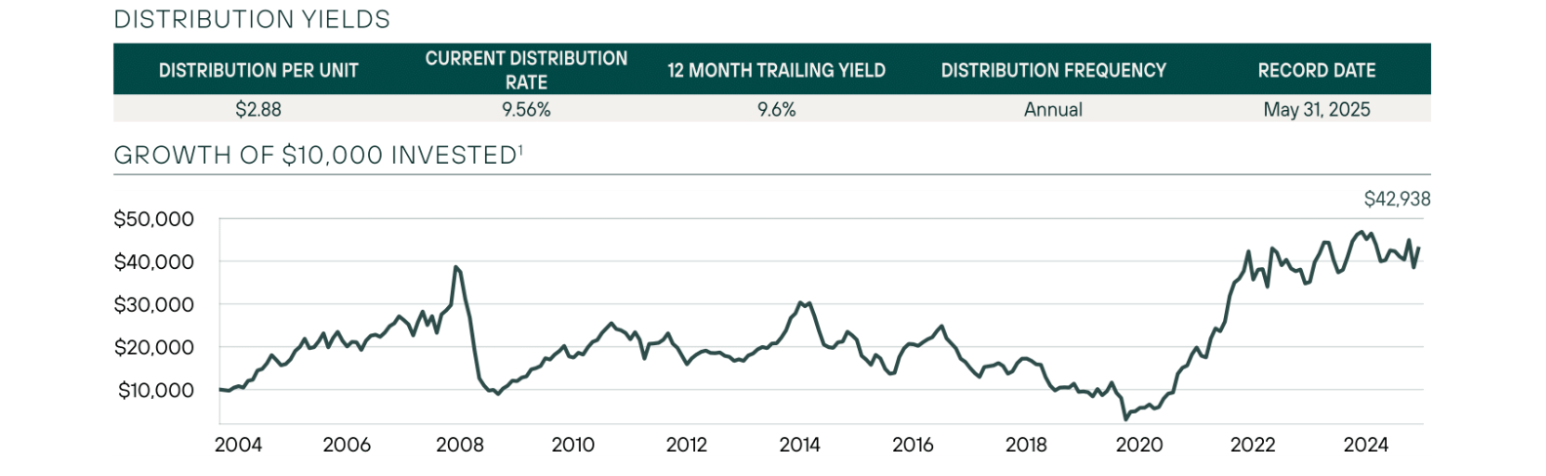
 Distribution Yield and Growth of $10,000 Invested
Distribution yield shows the annualized distribution yield based on the most recent payout. This figure is important for income-oriented investors. On the other hand, the chart illustrates how a hypothetical $10,000 investment would have grown over time, assuming all distributions were reinvested. It provides a simple visual representation of the fund’s long-term cumulative performance and helps investors evaluate the potential for wealth accumulation.
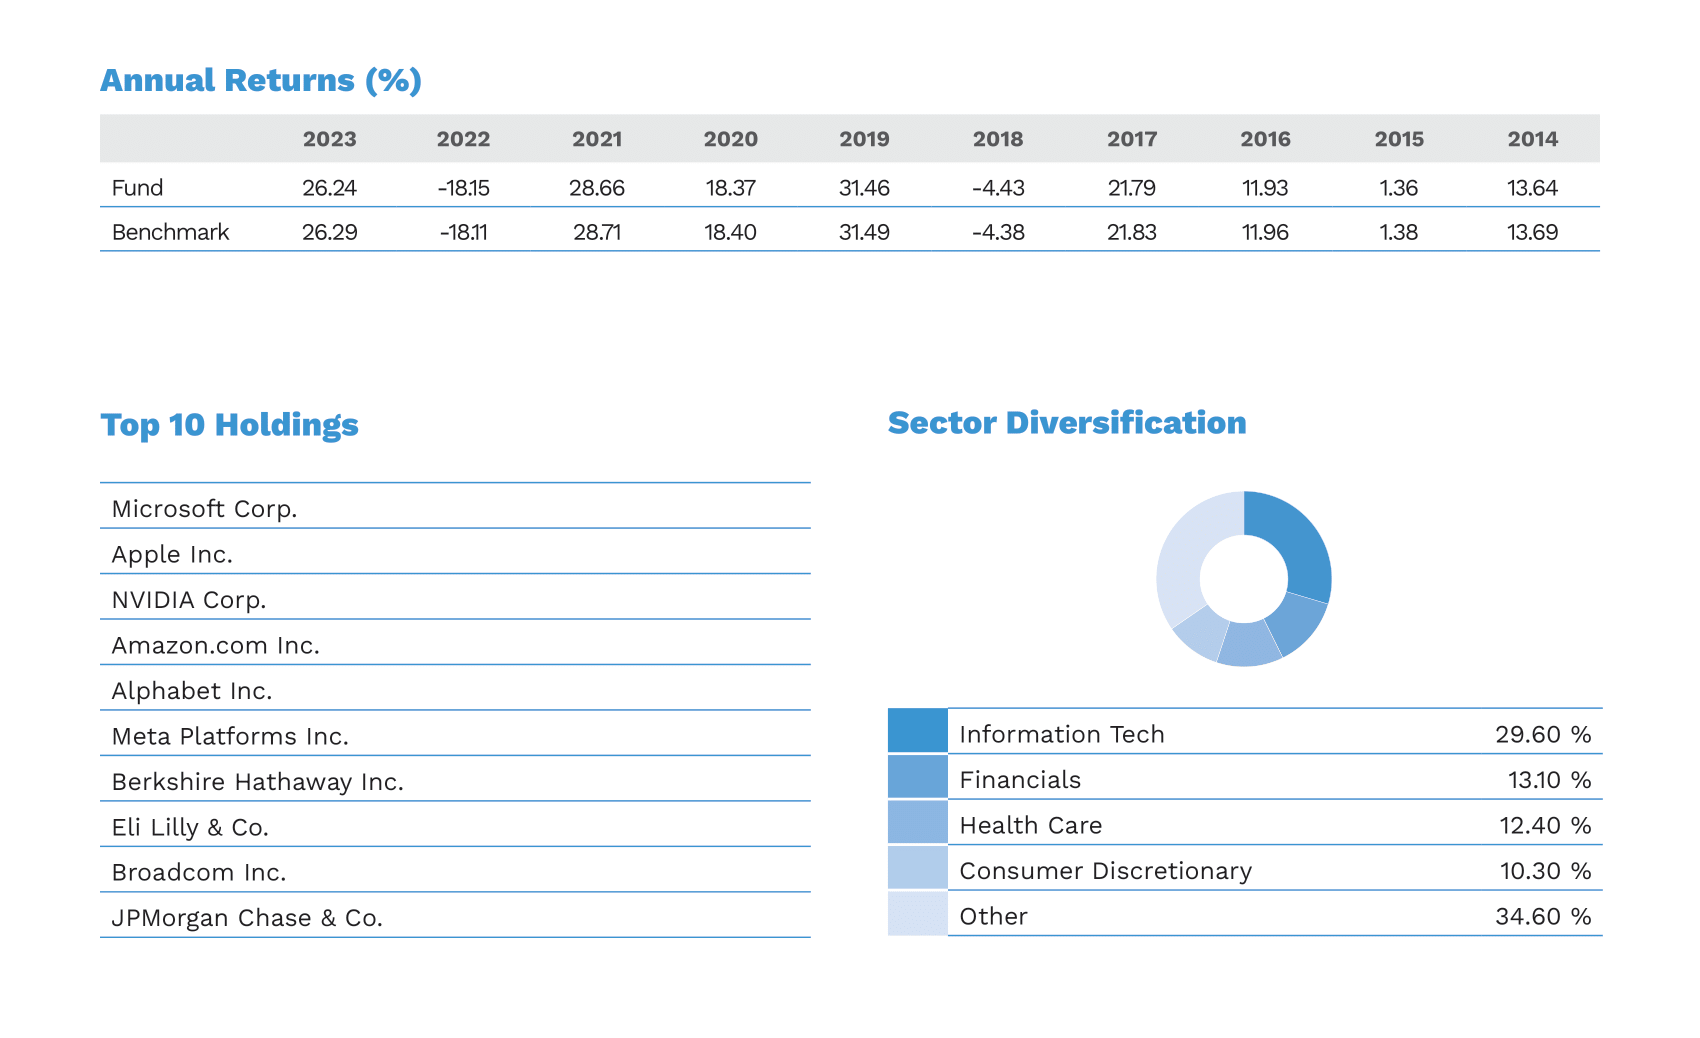
Top 10 Holdings
An updated table shows the fund’s top holdings as of the most recent month-end, including their weight in the portfolio. This gives investors insight into what’s driving the fund’s current performance.
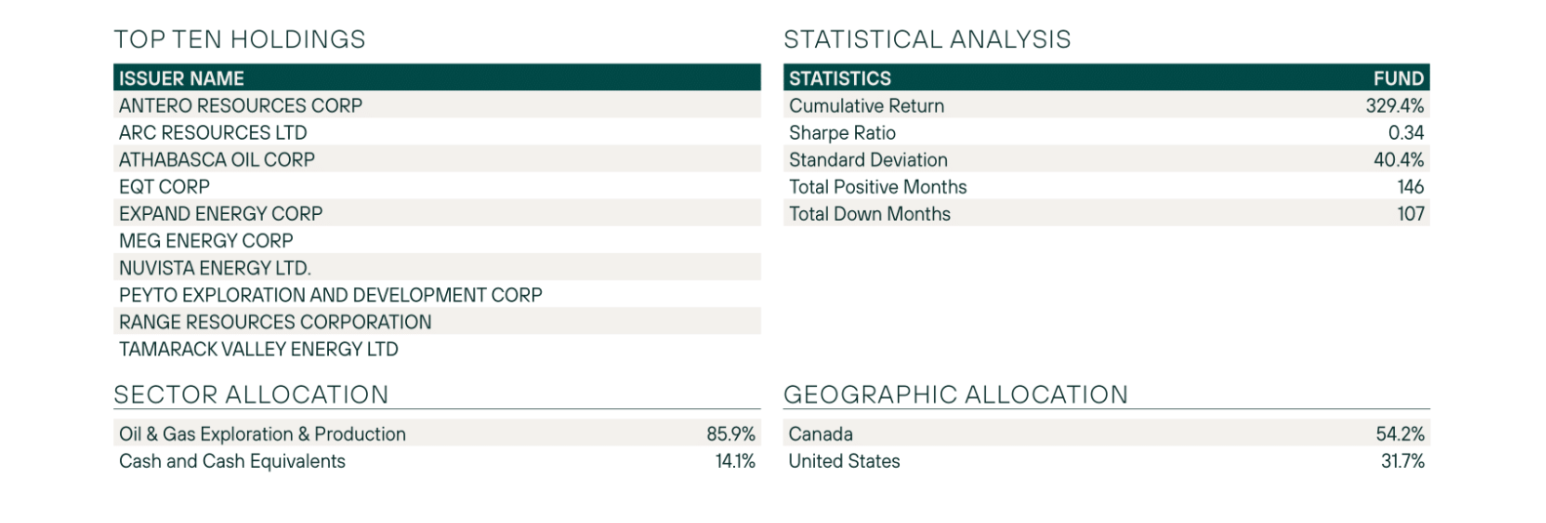
Sector Allocation
A breakdown of the fund’s exposure by industry sector, often presented as a table or bar chart. This helps illustrate the overall strategic positioning.
Geographic Allocation
This section lists the geographic exposure of the fund, showing which countries or regions the holdings are concentrated in.
Risk Metrics
Includes standard deviation, Sharpe ratio, and other statistics that help quantify volatility and risk-adjusted performance.
Automated Production with Pagination
For asset managers who need to update fund documents frequently, automating the process can be a game-changer. A fund fact sheet software like Pagination helps streamline the production of both regulatory and performance-based documentation by eliminating repetitive manual tasks.
Pagination offers a flexible and customizable solution designed to handle the unique challenges of fund reporting. It supports diverse layouts, multiple data sources and frequent updates, making it easier to produce accurate, compliant, and visually polished fund facts at scale. Read how Ninepoint Partners works with Pagination.
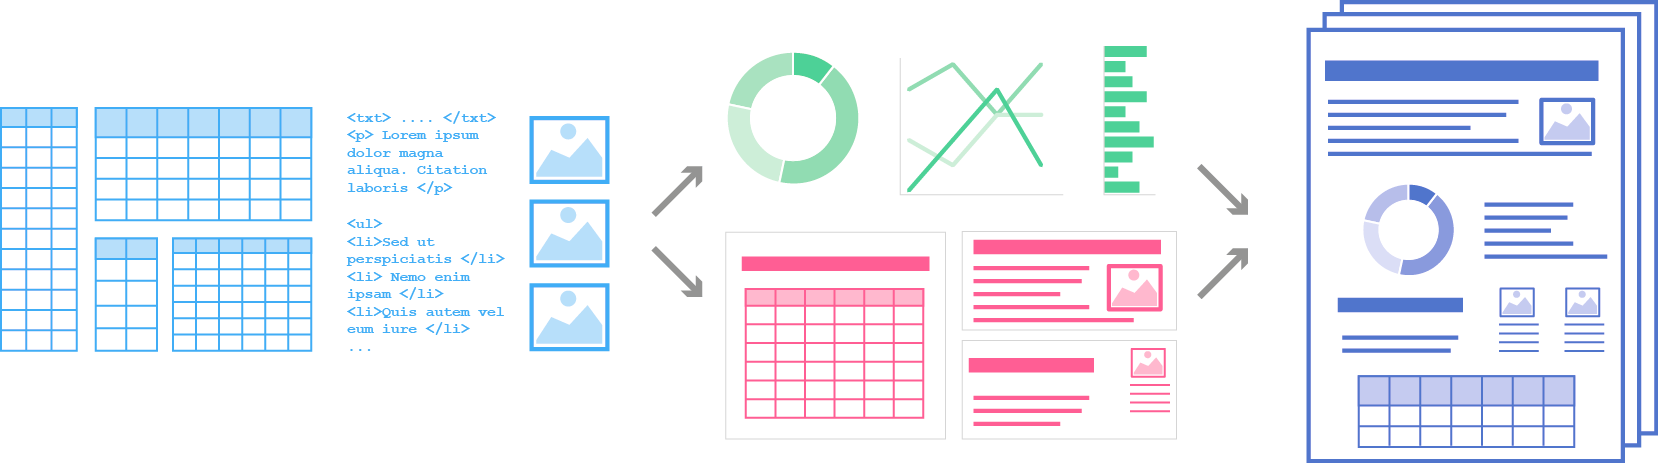
Modular Data Management
Instead of forcing a rigid template or single-sheet format, Pagination supports importing data from multiple sources or tabs within an Excel file. Each tab can contain a different category of information, such as performance data, portfolio composition, or risk metrics, allowing teams to maintain and update content easily without restructuring their workflow. This flexible data model helps eliminate errors and speeds up content updates.
Dynamic Layout Engine
One of the biggest challenges in creating fact sheets is fitting everything into a limited space, often a single page, without making the content feel cramped or overwhelming. Pagination addresses this with a custom layout engine that dynamically adjusts spacing, font sizes and table density based on content volume. This ensures the final result is always clean, visually balanced, and easy to read, no matter how much data needs to be shown.
Automated Chart Generation
Charts like performance bars, return tables, or asset allocation visuals are generated directly from source data. This eliminates the need for manual formatting or screenshot-based updates. Every time data changes, new financial charts are created automatically, ensuring consistency across editions and significantly reducing production time.
Integration with Static Content
Some parts of the document, like the cover, headers, or disclaimers, are static and don’t change month to month. Pagination integrates these fixed InDesign layouts with the dynamic content, ensuring that every page looks coherent and polished without requiring extra formatting or version control.
Pagination powers the automation of this monthly performance page. By connecting directly to structured fund data, Pagination generates charts, tables, and metrics in a clean, consistent format, month after month. This ensures each edition is up-to-date, visually accurate, and delivered on time, without the need for manual formatting.
Conclusion

A fund fact sheet isn’t just a formality. It’s one of the most powerful ways you communicate with investors, offering transparency, consistency, and decision-making clarity. To be effective, it needs to be clear, accurate, visually engaging, and regularly updated.
If your team is spending hours manually creating or refreshing fund facts each month, it might be time to rethink the process. With a fund fact sheet automation platform like Pagination, you can eliminate repetitive work, reduce risk of error, and ensure every document reflects the most current and compliant version of your data.
Ready to automate your fund reporting workflow? Watch the demo to learn how we can help you scale document production with precision.